
February 10, 2025
New Relic vs Splunk vs Grafana: A Comprehensive Comparison

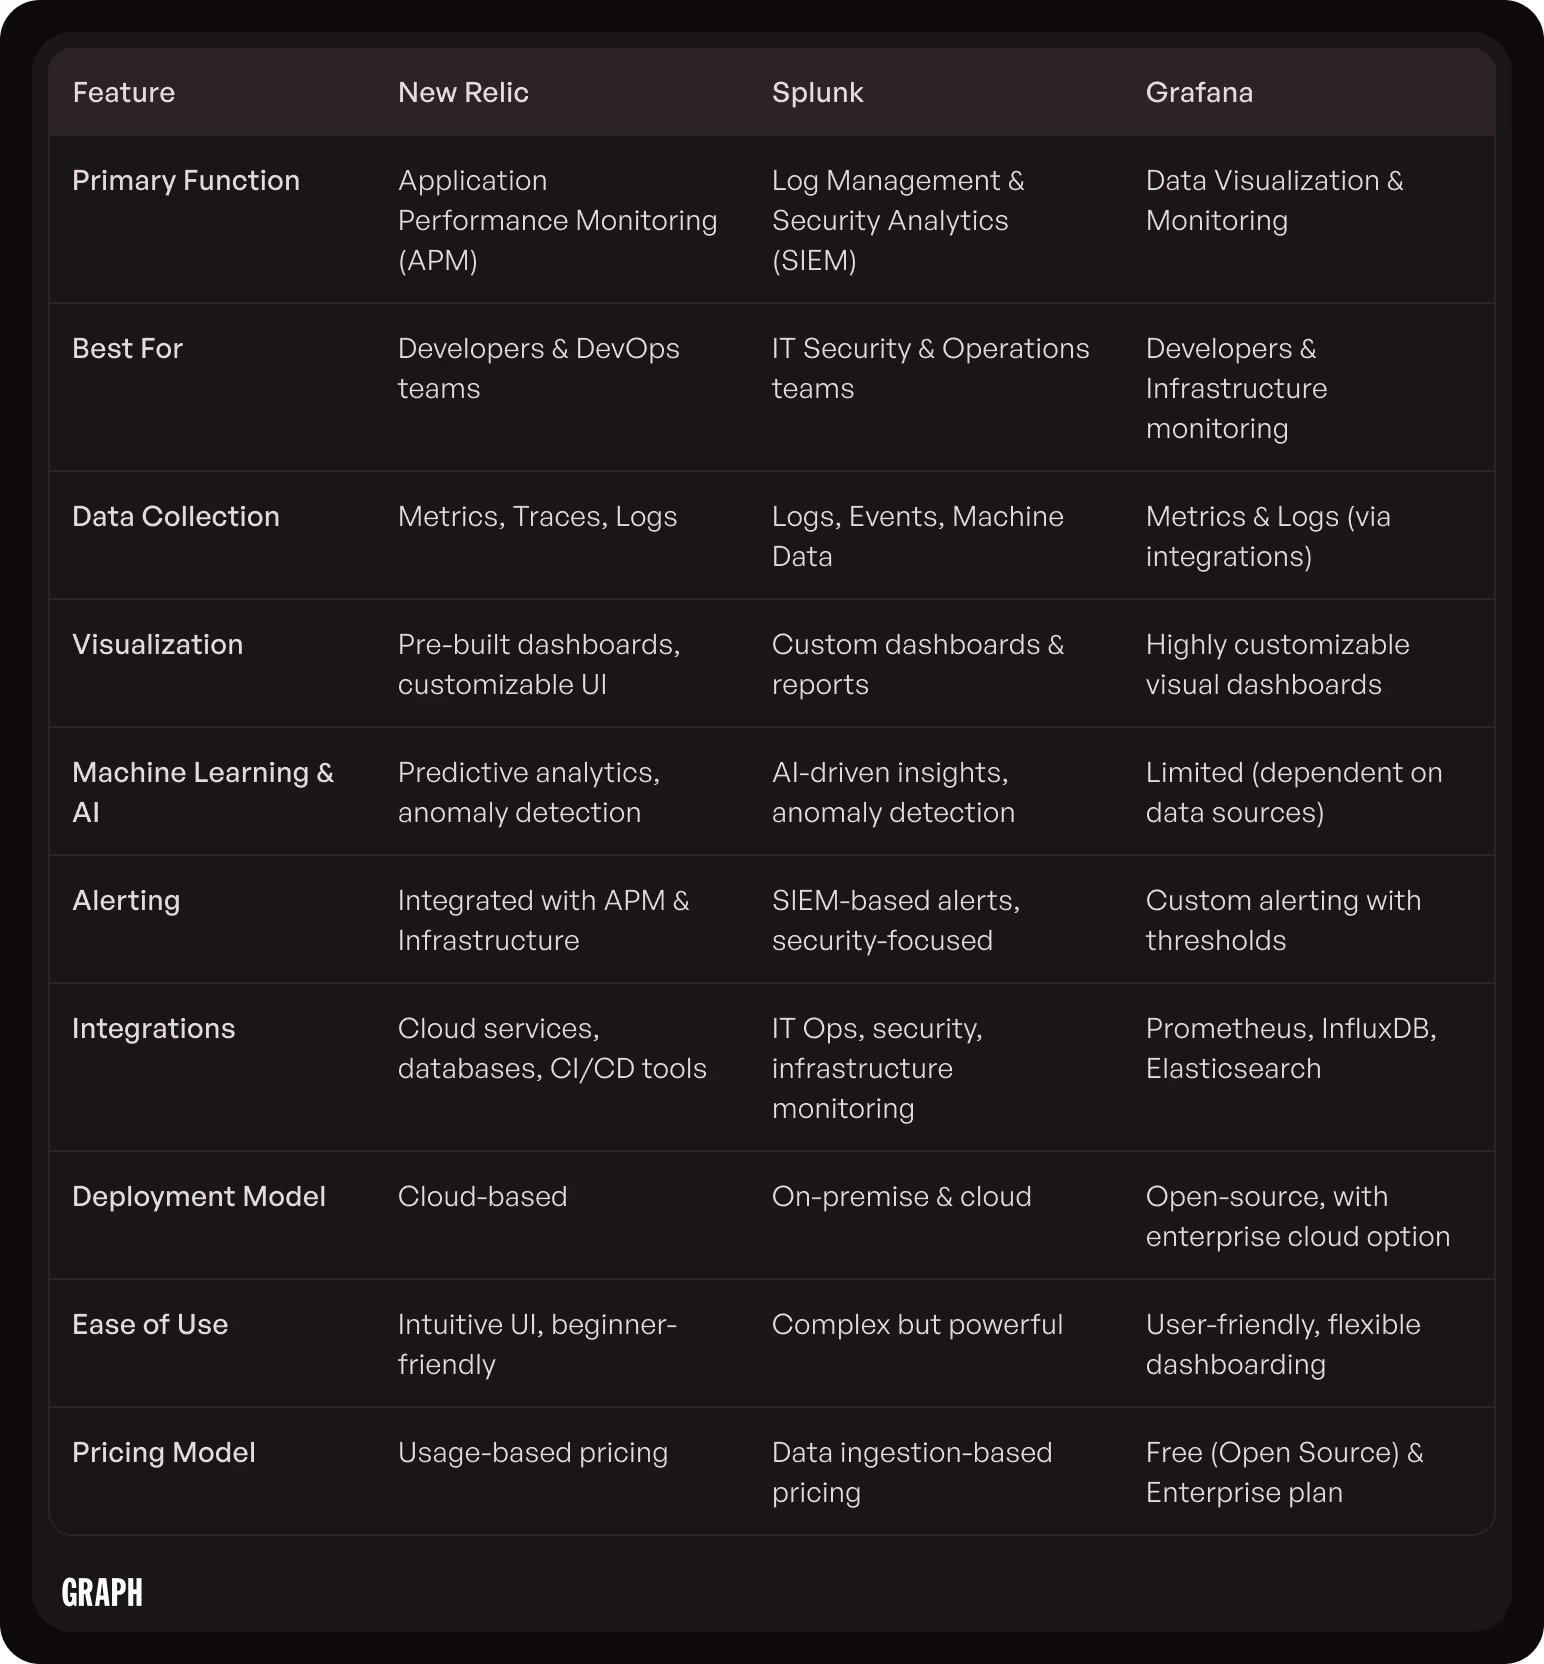
In the rapidly evolving field of software development and IT operations, monitoring and analytics tools play a critical role in maintaining application performance, security, and overall operational efficiency. This article delves into three prominent tools—New Relic, Splunk, and Grafana—providing a comprehensive comparison to help developers and IT professionals make informed decisions about which tool best suits their needs.
Understanding the Basics: New Relic, Splunk, and Grafana
Before diving into the features and functionalities of each tool, it's essential to understand what exactly New Relic, Splunk, and Grafana are, and how they fit into the landscape of application monitoring and analytics.
What is New Relic?
New Relic is a cloud-based observability platform that provides real-time analytics of application performance and user experience. It offers solutions to monitor web and mobile applications, infrastructure, and logs, enabling developers to gain insights into bottlenecks and issues affecting performance.
One of the standout features of New Relic is its APM (Application Performance Monitoring) capabilities, which provide deep visibility into application transactions and their impact on end-user experience. By using New Relic, organizations can proactively identify performance issues and optimize their systems for better user satisfaction.
Additionally, New Relic's user-friendly interface and robust reporting tools allow teams to track key performance indicators (KPIs) effectively. The platform also supports integration with various third-party services, enhancing its functionality and enabling a more comprehensive view of application health. This integration capability is particularly beneficial for organizations that utilize multiple tools for their development and monitoring processes, as it streamlines workflows and improves collaboration across teams.
What is Splunk?
Splunk is often dubbed the “Google for machine data.” It specializes in collecting, indexing, and analyzing log and event data generated by applications, IT infrastructure, and user activity. It’s a powerful tool for security information and event management (SIEM), operational intelligence, and troubleshooting.
The strength of Splunk lies in its ability to handle vast amounts of unstructured data. Users can execute complex searches, generate reports, and visualize data easily, making it an essential tool for IT operations and security teams looking to glean insights from their data quickly.
Moreover, Splunk's machine learning capabilities allow organizations to predict potential issues before they escalate, providing a proactive approach to incident management. The platform's versatility extends to its ability to integrate with various data sources and services, which enhances its analytical capabilities. This adaptability is crucial in today’s fast-paced IT environments, where the ability to respond to incidents swiftly can significantly reduce downtime and improve overall operational efficiency.
What is Grafana?
Grafana is an open-source analytics and monitoring solution that excels in data visualization. It integrates with a variety of data sources, including Prometheus, InfluxDB, and Elasticsearch, allowing users to create interactive and shareable dashboards that visualize metrics and logs.
Grafana is particularly favored by developers for its flexibility and customization options. Its ability to create diverse graphs, heatmaps, and alerts makes it a versatile tool for monitoring system performance and gaining insights from metrics in real time.
In addition to its visualization capabilities, Grafana also supports alerting features that notify users of anomalies or performance thresholds being breached. This proactive alerting mechanism ensures that teams can address issues before they impact users, thereby maintaining a high level of service reliability. Furthermore, the active community surrounding Grafana contributes to its continuous improvement and expansion of features, making it a popular choice for organizations looking to leverage open-source solutions in their monitoring strategies.

Key Features of Each Tool
Now that we have a foundational understanding of these tools let’s explore the key features that distinguish them in the marketplace.
New Relic's Standout Features
New Relic’s APM capabilities provide comprehensive transaction tracing, enabling developers to visualize the path of a request through their application stack. This is critical for diagnosing slow code paths or database queries.
Moreover, New Relic offers an intuitive user interface with customizable dashboards, allowing users to tailor the information displayed to suit the needs of their teams. With built-in notifications and alerting features, teams can respond quickly to performance degradations.
In addition to these features, New Relic integrates seamlessly with a wide array of third-party services, enhancing its functionality and allowing teams to consolidate their monitoring efforts. The platform's support for distributed tracing is particularly beneficial for microservices architectures, as it helps teams understand the interactions between various services and pinpoint bottlenecks in real-time. Furthermore, New Relic's synthetic monitoring capabilities allow users to simulate user interactions, providing insights into how applications perform under different conditions and ensuring a consistent user experience.
Splunk's Unique Capabilities
Splunk’s ability to ingest and analyze vast amounts of machine data is one of its most significant advantages. Its powerful search capabilities allow users to filter and correlate data, generating actionable insights from logs and reports.
Additionally, Splunk provides robust support for AI-driven analytics, employing machine learning algorithms to identify anomalies and predict potential issues before they impact performance, thus enhancing overall operational resilience.
Splunk also excels in its ability to create custom dashboards and visualizations, making it easier for teams to interpret complex data sets. Its extensive library of pre-built apps and add-ons allows organizations to extend functionality and tailor the platform to their specific needs. Moreover, Splunk's real-time data processing capabilities mean that teams can monitor their systems continuously, ensuring that they are always informed about the status of their applications and infrastructure. This level of visibility is essential for maintaining compliance and security in today's data-driven environments.
Grafana's Noteworthy Features
Grafana's primary strength lies in its visualization capabilities. With a plethora of chart types and a powerful query editor, users can mold their data into meaningful insights. Grafana's support for templating allows users to create dynamic dashboards, addressing various metrics across different applications.
Furthermore, Grafana's alerting feature provides proactive notifications based on user-defined thresholds, enabling real-time awareness of performance issues across systems.
Grafana also stands out for its extensive data source integrations, allowing users to pull in data from multiple platforms such as Prometheus, InfluxDB, and Elasticsearch. This flexibility makes it an ideal choice for organizations that utilize a diverse set of monitoring tools. Additionally, Grafana's community-driven approach means that users have access to a wealth of plugins and extensions, enabling them to customize their experience further. The platform's focus on collaboration allows teams to share dashboards easily, fostering a culture of transparency and collective problem-solving. This collaborative aspect is crucial in fast-paced environments where quick decision-making can significantly impact business outcomes.
Pricing Structure: New Relic, Splunk, and Grafana
Understanding the pricing structures of these tools is essential for organizations to budget their spending on monitoring solutions effectively.
New Relic Pricing Details
New Relic operates a consumption-based pricing model, meaning costs are determined by the amount of data ingested and the number of monitored hosts. This scalability can be beneficial for small-scale applications that may expand over time. However, proper forecasting is required as increased usage can lead to unexpected costs. Additionally, New Relic offers various pricing tiers that include different levels of features, such as APM, infrastructure monitoring, and browser monitoring, allowing organizations to choose a plan that aligns with their specific needs. Companies should also consider the potential benefits of leveraging New Relic's integrations with other tools, which can enhance their monitoring capabilities and provide deeper insights into application performance.
Splunk Pricing Breakdown
Splunk uses a tiered pricing model based on data ingested per day. This can become quite costly for organizations with high data volumes. However, it includes various packages, such as Splunk Cloud and Splunk Enterprise, which cater to different needs. Organizations must assess their data requirements carefully to manage costs effectively. Furthermore, Splunk offers a free trial period, allowing businesses to evaluate the platform's capabilities before committing to a paid plan. This trial can be particularly beneficial for teams looking to understand how Splunk can fit into their existing workflows and whether the investment will yield a significant return in terms of operational efficiency and data insights.
Grafana Pricing Information
Grafana is open-source, which means that the basic functionalities are free. However, for enterprise-level features and support, Grafana offers a paid enterprise plan that comes with advanced capabilities, security features, and dedicated customer support. This pricing model makes Grafana an attractive option for teams looking to get started without significant upfront costs. Additionally, Grafana's flexibility allows users to integrate with various data sources, such as Prometheus, InfluxDB, and Elasticsearch, enhancing its utility as a visualization tool. Organizations can also take advantage of Grafana's community support and extensive documentation, which can help teams troubleshoot issues and optimize their dashboards for better data representation and analysis.
Strengths and Weaknesses: A Side-by-Side Comparison
A comparative analysis of strengths and weaknesses can help users evaluate which of these tools best aligns with their needs.
Strengths of New Relic
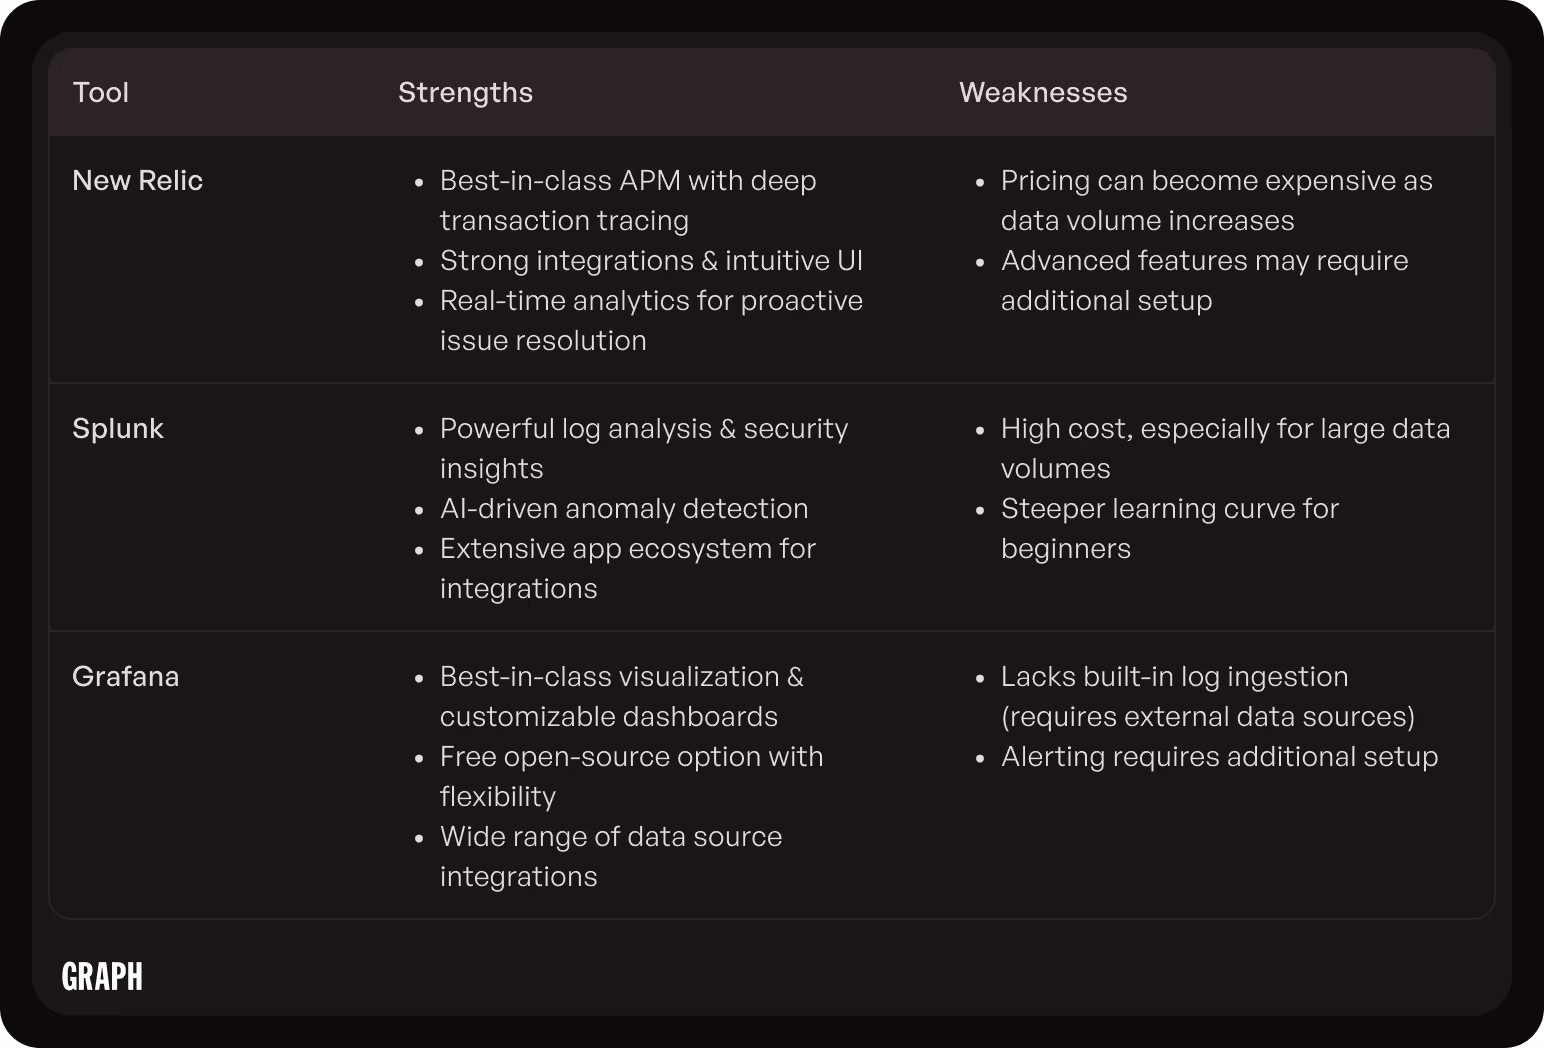
New Relic excels in APM, offering deep visibility into application performance, user interactions, and system metrics. Its intuitive interface and strong integration capabilities make it easy for teams to adopt and leverage its functionalities quickly. The platform also provides real-time analytics, enabling developers to detect and resolve performance bottlenecks before they impact end-users. Furthermore, New Relic's extensive documentation and community support can significantly enhance the onboarding process, making it easier for teams to maximize the tool's potential from the outset.
Weaknesses of New Relic
However, New Relic's pricing can become a concern as usage increases. Some users report that certain advanced features may require additional costs or complex configurations, which can be a barrier for smaller teams. Additionally, while New Relic provides a wealth of data, the sheer volume of information can sometimes lead to analysis paralysis, where teams struggle to prioritize actionable insights amidst the noise. This can be particularly challenging for organizations that lack dedicated resources to sift through the data effectively.
Strengths of Splunk
Splunk's primary strength lies in its ability to analyze vast amounts of machine data, providing robust search and reporting functionalities. Its powerful analytics and machine learning capabilities allow teams to identify patterns and predict issues effectively. Moreover, Splunk's ability to ingest data from a wide variety of sources, including logs, metrics, and events, makes it a versatile choice for organizations looking to centralize their data analysis efforts. The platform also supports real-time monitoring, which is crucial for maintaining operational efficiency and security across complex IT environments.
Weaknesses of Splunk
On the flip side, Splunk can be quite costly compared to its competitors, especially for organizations with high data volumes. Additionally, its user interface can be overwhelming for newcomers, requiring a learning curve to harness its full potential. Users may find themselves needing extensive training or support to navigate the platform effectively, which can slow down the adoption process. Furthermore, while Splunk offers a wealth of features, some users feel that the complexity of the tool can lead to underutilization of its capabilities, as teams may focus only on the most basic functionalities.
Strengths of Grafana
Grafana’s strength lies in its flexibility and visualization capabilities. Its integration with multiple data sources and its customizable dashboards allow users to tailor their monitoring experience to fit their needs best. Grafana shines in its ability to create visually appealing and informative graphs, charts, and panels that can help teams quickly interpret data trends and anomalies. The open-source nature of Grafana also fosters a vibrant community that contributes plugins and features, enhancing the tool's functionality and adaptability to various use cases.
Weaknesses of Grafana
However, Grafana's monitoring capabilities depend heavily on the underlying data sources, which may limit its effectiveness in certain scenarios. Additionally, users may need to undertake additional configurations for alerting and notifications compared to more integrated solutions like New Relic or Splunk. This reliance on external data sources can lead to challenges in data consistency and accuracy, especially if those sources are not well-maintained. Moreover, while Grafana's dashboard customization is a significant advantage, it can also become a double-edged sword; users may spend considerable time designing dashboards that meet their specific needs rather than focusing on data analysis and decision-making.
User Experience: Ease of Use and Interface
The user experience can significantly impact how effectively teams utilize these monitoring tools.
User Experience with New Relic
Most users appreciate New Relic's clean and intuitive interface, which facilitates ease of navigation and quick access to vital metrics. The onboarding process is relatively straightforward, making it beginner-friendly for teams. Additionally, New Relic offers a wealth of documentation and community support, which can be particularly beneficial for new users looking to maximize the platform's capabilities. The integration of various plugins and APIs further enhances its usability, allowing teams to tailor their experience to fit specific workflows and requirements.
User Experience with Splunk
In contrast, Splunk's interface can initially overwhelm users due to the plethora of options available. However, once familiarized, many users find its powerful search and analytics features to be invaluable despite the complexity. The robust data visualization tools within Splunk enable users to create detailed reports and dashboards, which can be crucial for in-depth analysis. Furthermore, Splunk's ability to handle large volumes of data makes it an essential tool for organizations that require real-time insights, although the learning curve may deter some users from fully leveraging its potential.
User Experience with Grafana
Grafana stands out for its user-friendly interface and customizable dashboards, which allow for dynamic presentations of real-time data. Users particularly enjoy the interactivity of its dashboards, fostering collaboration and streamlined decision-making processes across development teams. The platform's support for multiple data sources enables teams to visualize data from various platforms in one cohesive view, enhancing overall efficiency. Additionally, Grafana's active community contributes to a rich ecosystem of plugins and shared dashboards, allowing users to continuously improve their monitoring setups and adapt to evolving project needs.
Integration Capabilities
For monitoring tools to deliver real value, they need to integrate seamlessly with various data sources and platforms. This integration not only enhances the functionality of the tools but also enables organizations to gain a holistic view of their operations, ensuring that teams can respond swiftly to any issues that arise.
Integration Options with New Relic
New Relic supports a wide range of integrations with popular cloud services, libraries, and databases, allowing teams to monitor applications deployed across different environments. APIs and SDKs are readily available for custom integrations, which empower developers to tailor the monitoring experience to their specific needs. Additionally, New Relic's ability to integrate with CI/CD pipelines facilitates real-time performance monitoring, enabling teams to catch potential issues early in the development process. This proactive approach not only improves application reliability but also enhances user satisfaction by ensuring that performance metrics are consistently met.
Integration Options with Splunk
Likewise, Splunk offers numerous integrations with IT operations and security tools. Its extensive app ecosystem enables the quick addition of functionalities, making it adaptable to different organizational needs. Splunk's ability to ingest and analyze vast amounts of machine-generated data from various sources allows organizations to gain actionable insights into their operations. Furthermore, with features like Splunk Phantom, teams can automate responses to security incidents, streamlining workflows and reducing response times. This level of integration not only enhances operational efficiency but also fortifies an organization's security posture by enabling real-time threat detection and response.
Integration Options with Grafana
Grafana's compatibility with various data sources such as Prometheus, InfluxDB, and Elasticsearch allows it to fit seamlessly into existing infrastructures. The flexibility of Grafana’s plugins further enhances its integration capabilities, catering to diverse monitoring requirements. Users can create custom dashboards that pull in data from multiple sources, providing a unified view of system performance. This capability is particularly beneficial for teams that manage complex microservices architectures, as it allows for the visualization of interdependencies and performance metrics across services. Additionally, Grafana's alerting features enable teams to set thresholds and receive notifications, ensuring that they can proactively address issues before they impact end-users.
Final Verdict: Which Tool is Right for You?
The choice between New Relic, Splunk, and Grafana ultimately depends on your team's specific needs and constraints. New Relic is ideal for those seeking an integrated APM solution with user-centric analytics, while Splunk is suitable for organizations requiring deep insights into machine data. Grafana is a perfect fit for teams emphasizing data visualization and flexibility.
Consider your organization's budget, existing infrastructure, and the skill set of your team before making a decision. Each tool has its strengths and weaknesses, and the right choice will align with your overall objectives for monitoring and performance management.
